
Ask three detection engineers on the same team to build the same rule. You get three different rules. Nobody is wrong. The process is unwritten, so each person runs their own version of it. One checks for a duplicate rule first, one does not. One baselines the volume over 30 days, one looks at yesterday. One writes down why an exclusion exists, two do not.
This is survivable with three humans who talk to each other. It stops being survivable when you add a coding agent, because the agent has no memory of yesterday. Every session starts from zero. If the process lives in a person's head, the agent invents a fresh process each morning, and every one of them looks reasonable.
A coding agent amplifies whatever process you already have. A written process gets faster. An unwritten process gets faster at being inconsistent.
So the work is not prompt engineering. The work is writing your process down, and then moving the mechanical parts of it into code.
First, the process itself
Before the tooling makes sense, here is the process we are making repeatable. It has four stages, and every rule goes through all four, in order.
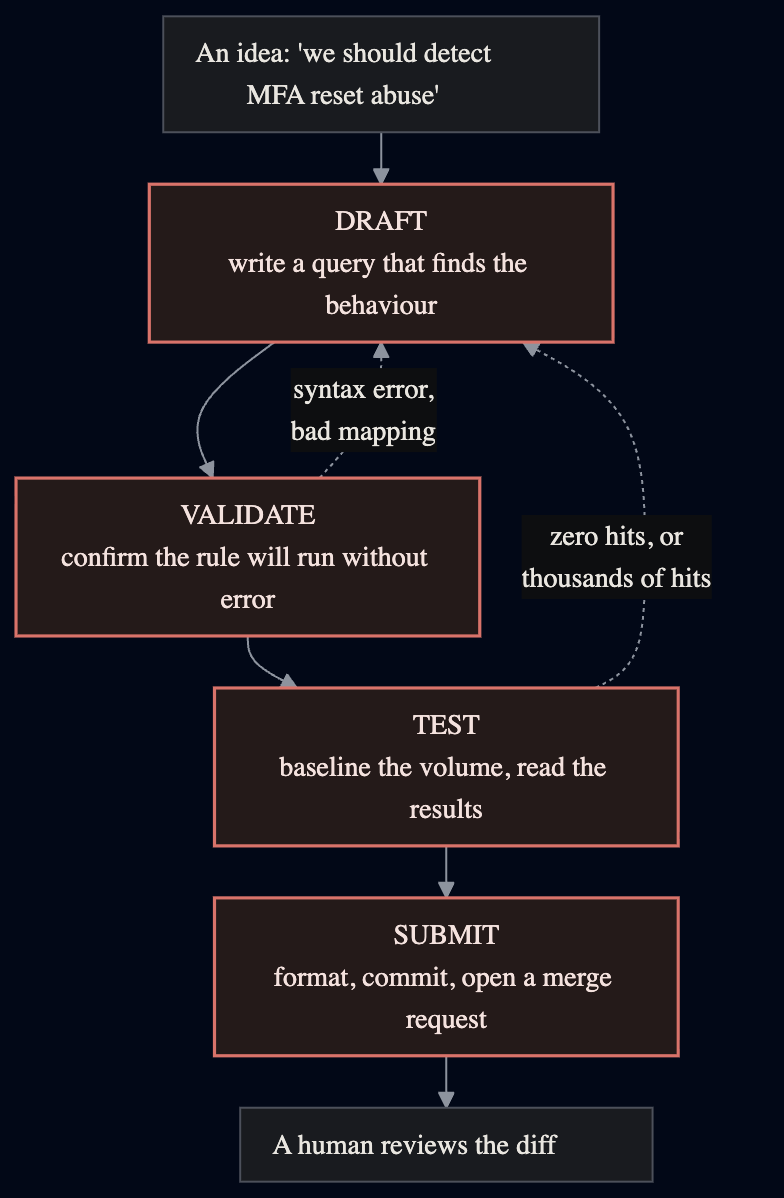
Draft. You write a query that finds the behaviour. This is the only creative stage. It needs live access to the SIEM, because you cannot write a working query against a schema you are guessing at. You look at what event types the source really emits, which fields are really populated, and what the values really look like. I wrote about this stage on its own in an earlier post about getting a language model to write good queries.
Validate. You confirm the rule will not break when the platform runs it. This is mechanical, not a judgement. Do the brackets balance? Is the tactic in ID form? Is the technique actually a child of that tactic? Is the lookback zero, or longer than the platform allows? Does the file carry the metadata the repository requires? Every one of these has exactly one right answer, so a machine should decide it.
Test. You run the query over real history and look at what comes back. There are two halves, and teams usually do only the first. The first half is the count: zero results over 30 days means the rule can never fire, and 4,000 results means you have written a report. The second half is reading the actual rows. Who are these users? Is this the same service account 40 times? The count tells you whether the rule is viable. The rows tell you whether it is right.
Submit. You put the rule into the detection repository in the shape your organisation expects. Branch naming, commit message, the ticket reference, the merge request description, the reviewer, and who is allowed to merge. None of this is interesting, all of it is mandatory, and it is the stage where people most often differ from each other.
Everything below is about making an agent execute those four stages the same way every time, without you standing over it.
Three kinds of file
Our whole setup is one Claude Code plugin. Inside it there are three kinds of file, and the distinction between them is the entire design.
| Kind | What it is | When it runs |
|---|---|---|
| Skill | Knowledge and routing, as markdown | Loaded automatically when the task matches its description |
| Command | A named, ordered procedure, as markdown | Only when a person invokes it, /draft-rule |
| Script | A Python helper that does one deterministic thing | Only when a skill or command calls it |
The plugin looks like this:
siem-master-plugin/
├── plugin.json
├── commands/
│   ├── draft-rule.md          # the four workflow stages,
│   ├── validate-rule.md       #   one command each
│   ├── test-rule.md
│   ├── submit-rule.md
│   ├── hunt.md                # ad-hoc search
│   └── setup.md               # credential setup
├── skills/
│   ├── detection-engineering/ # the router: which command, in what order
│   ├── logscale-queries/      # query syntax + ~20 per-source field docs
│   ├── dac-detections/        # read-only questions about the rule repo
└── scripts/
    ├── siem_query.py     # run a search. read-only
    ├── dac_repo.py            # repo mechanics: status, pull, branch, push, validate
    └── gitlab_api.py          # open a merge request
Two things about this shape are worth copying.
The plugin is how the process reaches other people. A skill on my laptop helps me. A skill in a plugin that my teammates install helps the team, and everybody resolves the same field names and the same format standard. This has a direct consequence in how the files are written: our drafting command says, in as many words, do not read the field reference from a local clone in somebody's home directory, and do not depend on a personal memory file, because neither exists on a teammate's machine. If a fact matters to the process, it ships in the plugin.
Commands are for procedures, skills are for knowledge. A command is a sequence with a beginning and an end, and the person chooses to start it. A skill is a body of knowledge that should appear whenever it is relevant, without anybody asking. Putting a procedure in a skill means it fires when you did not want it. Putting knowledge in a command means it is unavailable unless you remember to run it.
Skills describe judgement. Scripts do the deterministic work.
This is the decision that separates a demo from something a team uses daily.
The test is one question. Does this step have exactly one correct output for a given input?
If yes, write a script and have the command call it. If no, leave it to the model, and write down how to think about it.
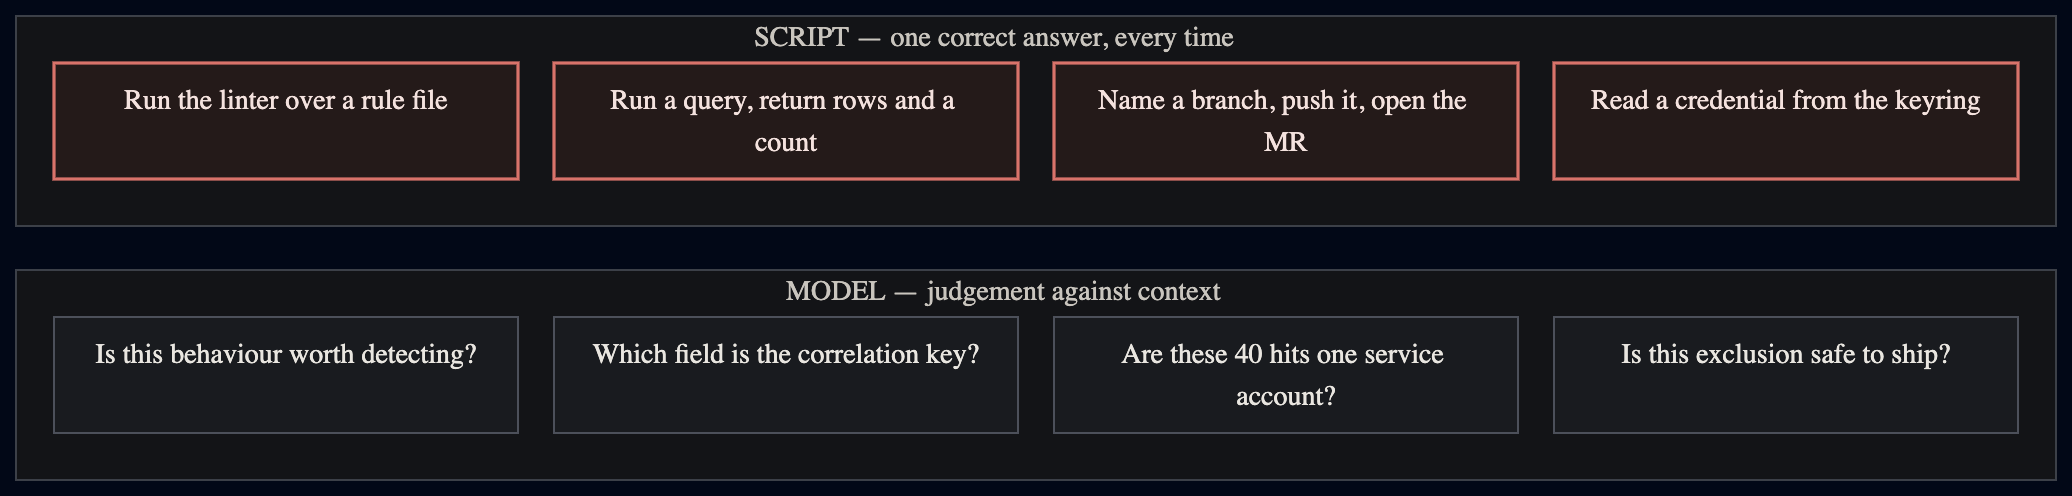
The common failure is subtle. An engineer writes a skill that says "check the rule has an entity to group by, a severity, and a valid technique ID". The model reads that and checks those things by eye. It is right most of the time. Most of the time is not a standard.
Write the check as code. Then the command says one thing: run it.
Stage one: draft
/draft-rule is the longest of the four commands, because drafting is the stage with the most judgement in it.
It starts by checking that the repository clone exists, using dac_repo.py status. Then it collects what it needs from the analyst: the behaviour, the log source, the MITRE tactic and technique, the severity, and the expected volume. If any of those are missing it asks, in one question, rather than guessing. It refuses to guess a severity above medium without the analyst saying so.
Then it reads three things before it writes any query text:
- the field reference for that specific log source, which ships inside the query skill as one markdown file per source,
- an existing rule that acts as the canonical template for field order and shape,
- the house format standard, which is written inline in the command itself.
That third one is a deliberate choice. The format standard is short and mandatory, so it lives in the command as the authoritative copy rather than in a reference file that could drift. Every rule's query has to enrich the pivot address with geolocation and ASN, group by one entity, collect the fields the analyst needs in the alert, and build a human-readable description string. Those four requirements are what make an alert triageable in our environment, and they are checked again by the linter in the next stage.
After the query, the command renders the YAML, writes it to the rules directory, refuses to overwrite an existing file, and then immediately runs the validator once and fixes what it can.
The lesson buried in this command
Near the top of /draft-rule there is a section that has nothing to do with detections:
This command is stateless across invocations. Even if you just finished drafting another rule in this same session, treat this invocation as a clean start. Do not reuse the ticket from a previous run. Do not carry over severity, tactic, technique, or allow lists from a sibling rule. Re-read the context files rather than relying on memory of what they said last time.
That exists because of a real failure. Two related rules from the same incident got drafted back to back, and the second one inherited the first one's ticket and severity. Both looked correct. Someone had to unpick it after the merge request was already open.
An agent in a long session behaves like a colleague who is sure they remember. Where a stage must start clean, say so in the file, and say why.
Stage two: validate
The validator is not in the plugin. It is in the detection repository, next to the rules, as scripts/validate_rules.py. The plugin only wraps it:
python3 "${CLAUDE_PLUGIN_ROOT}/scripts/dac_repo.py" validate --rule <path>
That wrapper filters the JSON report down to the one rule and exits 0 on a pass, 3 on violations.
Keeping the linter in the rules repository matters more than it sounds. It means the standard travels with the rules, CI runs the same code the agent runs, and a person who has never installed the plugin can still check their work. The plugin is a convenience layer over the standard, not the home of it.
The checks have names, and the names appear in the output, which lets the command act on them:
$ python3 .../dac_repo.py validate --rule rules/okta_mfa_reset.yml
FAIL  rules/okta_mfa_reset.yml
  [house_format]     filter has no asn() on the pivot address
  [lookback_zero]    search.lookback is 0; rule will never match a window
  [mitre_technique]  T1110.003 is not a child of TA0006
3 violations
The interesting part of this command is not the checks. It is the list of violations the agent is allowed to fix by itself, and the list it is not.
Fix automatically, then re-validate: a missing enrichment or grouping call, a zero lookback, a tactic written as a name instead of an ID, a log source key that is one fuzzy match away from a valid one, a missing threat-intel confidence threshold on a rule that calls a lookup.
Never fix automatically: a duplicate rule ID or name, because that is a genuine conflict that needs an author's decision. A technique that does not map to the stated tactic, because the right fix depends on what the author meant to cover. Unbalanced brackets in the query, because it is ambiguous where the closing bracket belongs and a wrong guess produces a rule that runs and is silently incorrect.
That second list is where the design of this stage actually lives. The rule is not "let the agent fix violations". The rule is "let the agent fix violations where there is exactly one correct fix", which is the same test as everywhere else in this post.
Stage three: test
/test-rule pulls the query out of the YAML and runs it against real history through the same read-only search script the hunting workflow uses:
python3 "${CLAUDE_PLUGIN_ROOT}/scripts/siem_query.py" '<query>' \
  --start 7d --limit 500 --json
It reports the total, the per-day rate, the first and last match, and the top groups. Then it compares the rate against the severity the author chose, these are entirely arbitrary and organization-dependant:
| Severity | Expected rate | Verdict if higher |
|---|---|---|
| Informational | No cap | Always fine |
| Low | Up to 20 per day | Warn |
| Medium | Up to 5 per day | Warn |
| High | Up to 1 per day | Warn |
| Critical | About 2 per week | Warn |
This table is doing something specific. It converts an argument about severity into an arithmetic check. "This feels like a high" becomes "a high-severity rule that produces 43 alerts a day is a low-severity rule, or it is a broken query". Nobody has to have that conversation twice.
The command then prints three to five sample rows. This is the half of testing that teams skip, and it is the half that catches the wrong kind of correct. Forty hits is a plausible count for a real detection. Forty hits that are all the same backup service account is not a detection at all. A count cannot tell you which one you have, and a person reading five rows can tell you in ten seconds.
Zero results gets its own verdict, and it is deliberately suspicious rather than reassuring: either the behaviour really is that rare, or the query is broken and you should prove it fires against a known event before you go any further.
Stage four: submit
Submission carries no security judgement at all. It is pure convention, which makes it the best candidate for full automation.
/submit-rule refuses to do anything until validation passes. Then it pulls the latest main so the diff is clean, creates a branch named from the rule and the submitter, commits the rule file, pushes with a shared token, and opens a merge request with a filled-in description:
python3 .../dac_repo.py  pull
python3 .../dac_repo.py  branch <slug>       # prints submission/<user>-<slug>-<timestamp>
python3 .../dac_repo.py  push <branch>
python3 .../gitlab_api.py open-mr --source <branch> --target main \
        --title "submission: <rule name>" --description "<generated>" \
        --assignee-username <reviewer>
The description is generated from the rule metadata and the volume baseline from the previous stage, and it ends with a review checklist: is the query defensible against the stated intent, does the severity match the measured volume, is the MITRE mapping accurate, is there a runbook.
The last line of the command is the important one. It prints the merge request URL and stops. The agent never merges. A human reads the diff, and the merge is what causes the rule to be applied to the platform.
One more detail that is easy to get wrong: the merge is also what marks the rule as deployed in our tracking, not the merge request opening. We had that backwards at first, and a tuning change to a live rule kept dragging that rule backwards through its own lifecycle.
The router skill makes it consistent
Nothing above forces the four stages to happen in order. Without a router, the agent picks whichever stages look relevant to the request and quietly skips the rest. It skips the duplicate search, because the analyst did not mention duplicates. It skips the baseline, because the query looked fine.
The router is a skill rather than a command, because it has to load itself. The analyst says "this rule is too noisy" and never types a slash command at all.
Its job is to recognise the situation and route:
---
name: detection-engineering
description: >
  Use when the user is authoring, tuning, testing, or submitting a correlation
  rule. Routes through the detection-as-code commands rather than the vendor UI.
---

Use this skill when the user mentions any of:
"new rule", "detection rule", "tune", "too noisy", "false positive",
"MITRE mapping", "deploy a detection", "push a rule".

The team's workflow is repo-based, not UI-based.

| Command         | When to suggest it                                  |
|-----------------|-----------------------------------------------------|
| /draft-rule     | The user wants a new detection. Start here.          |
| /validate-rule  | After drafting, or after any hand edit of a YAML.    |
| /test-rule      | Baseline the volume before submitting.               |
| /submit-rule    | Open the MR for review.                              |

Typical flow: draft → validate → test → submit.
Each command suggests the next one on success.

## When NOT to use this skill
- Investigating existing events        → the hunt command
- Inspecting a deployed rule's details → the correlation-rules skill
- Reconstructing activity on a host    → the timeline command
Two things make this work.
Each command suggests the next one. The chain does not depend on the model remembering the order. It is written at the end of every command, so the ordering survives even when the router is not loaded.
The "when not to use this" section is as valuable as the rest. Without it, a skill with a broad description gets pulled into every adjacent task and gives confident advice about work it was not written for.
Reference material belongs with the skill
The query skill is not just syntax rules. It ships about twenty markdown files, one for each log source we ingest: the real parser field names, the real event types, and the format of the values. They live in the plugin directory next to the skill that uses them.
This is where a lot of the value actually sits, and it is worth being direct about why they ship inside the plugin rather than living in somebody's notes:
- Everyone resolves the same field name for the same source. A rule I write and a rule you write refer to the same thing.
- The agent reads the file for the source in front of it, and nothing else. Twenty log source documents in context on every task would be wasteful. One, on demand, is cheap.
- A change to the reference is a change to a file in version control, which somebody reviews.
Personal memory files are still useful, and I keep plenty. They are just the wrong home for anything the team relies on. The drafting command says this outright, because the first version of it did the wrong thing and read from a path that only existed on my machine.
Design rules for scripts an agent will call
A script written for a human is not automatically safe for an agent. A few habits make the difference.
Exit non-zero on failure, and use distinct codes. Ours exits 3 specifically for validation violations, so the caller can tell "the rule is bad" apart from "the tool broke".
Print the raw upstream error. If the platform returns HTTP 400 with a parse position, print that. A script that catches the exception and prints "query failed" has deleted the one piece of information that would have fixed the problem on the next attempt.
Offer --json. A flag that costs ten lines and stops the model from parsing your table layout.
Name the missing thing, and the fix. Our query script exits with MISSING_CREDENTIAL, and the command that calls it knows to route the user to the setup command. An error that says what to run next does not need a human to interpret it.
Never prompt for input. An interactive confirmation stops an agent forever. Watch git in particular, which will happily prompt for credentials, an editor, or a merge message.
Read-only by default. The search script cannot create, modify, or delete anything. Its credential is scoped to search. The one script that writes is the one that opens merge requests, and it has its own token.
Write large outputs to disk and return the path. Our query script does this automatically. A 40,000-row result should never go into the context window.
Ask, do, enforce
A skill asks for the standard. A script performs it. Neither one enforces it, because a model can always decide not to call the script.
The third layer has to live outside the conversation.
CI is the reliable version. The same validator runs on every merge request. A rule that fails cannot merge, whoever or whatever wrote it. Most teams already have the mechanism and only need to point it at the linter.
Hooks are the fast version. Some harnesses can run a command whenever the agent writes a file. Kyrre Wahl Kongsgård's team at DNB uses a post-write hook that validates YAML the instant the agent saves it, which turns a CI failure twenty minutes later into a correction two seconds later.
If a standard exists only in the first layer, it is a suggestion.
The gap that none of this closes
Everything above proves the query parses, returns sensible rows from historical data, and arrives in the repository in the right shape. It does not prove the detection fires when somebody actually performs the behaviour.
Those are different claims. A rule can be perfect and still fail, because the lab hostname does not match a pattern in the rule, or the data source it references was retired last year, or a summarisation job lags behind the search window.
The best work I have read on this is Kongsgård's post on end-to-end detection validation from the DNB Cyber Defense Center. It is the same shape as everything here, run one step further:
- The agent reads a detection rule and works out what behaviour would trigger it.
- It writes a minimal attack simulation in TTPForge YAML, with a defanged payload that proves execution without doing damage.
- A post-write hook validates the YAML.
- The agent deploys the simulation to an isolated lab host over SSH and runs it.
- Per-step checks confirm the technique actually worked, not merely that a command ran.
- A verification agent polls the SIEM, first for the raw telemetry and then for the detection match.
- On failure, a debug agent classifies the stage: silent host, missing event, late arrival, or rule rejection.
Step 7 is the part I keep thinking about. A failure that names the broken stage is the difference between a test and a diagnostic. Their write-up is also honest about the rough edges, including an agent that modified forwarder configuration well beyond its intended scope. Worth your time.
Building this in your environment
Do it in this order. Each step is useful before you begin the next one.
Write down your stages. They may not be my four. Open a file and describe the last rule you built, step by step. That file is your first command, and its wrongness is now visible.
Find the steps with exactly one right answer. Those become scripts. Start with the linter, and put it in the repository with the rules, not in the plugin.
Make the scripts agent-safe. Distinct exit codes, raw errors, --json, no prompts, credentials from the OS keyring. An afternoon of work that removes a whole class of confusion.
Add read-only SIEM access. A scoped credential with search permission and nothing else.
Write one command per stage, and have each one name the next. This is what makes the chain survive a session where the router never loads.
Add the router skill. Trigger phrases, a table of commands, and a "when not to use this" section.
Package it. The moment a second person needs the process, everything it depends on has to ship together. Anything that lives in your home directory is not part of the process.
Add enforcement. The linter in CI first. A write hook after that, if your harness has them.
Field caveats
Anything in a personal file is invisible to your team. The fastest way to find these is to have a teammate install the plugin and run the workflow on a clean machine. Ours pointed at a documentation clone that only I had.
A command that describes what a script does will drift from the script. Reference the command and its exit codes. Never restate its logic.
Overlapping descriptions load the wrong skill. Write the description as when to use this, not what this is, and include the negative cases.
Agents carry state between runs of the same command. If a stage must start clean, say so at the top of the file, and say what specifically must not be reused.
A friendly error message destroys the feedback loop. Summarised errors cost far more retries than the raw text costs to read.
Skills rot faster than code. A platform limit changes, a command is renamed, and the file keeps saying the old thing with total confidence.
Let the agent fix only what has one correct fix. Everything else is a violation it reports to a human. Auto-fixing an ambiguous problem produces a rule that passes and is quietly wrong.
Closing
Read the list again and there is very little about artificial intelligence in it. A linter that lives with the rules. Three small scripts with honest exit codes. Four written procedures. A packaging step so the team gets the same copy. Enforcement in CI. Every one of those is something a detection team should have built before anyone shipped a coding assistant, and most teams, mine included, had not.
What changed is the return on the work. Documentation that a human reads twice a year is hard to justify. Documentation that is read on every single task, by something that follows it exactly, pays for itself in a week.
