
My last two posts were about building detections faster. The first covered getting a language model to write queries that match your real telemetry instead of its imagination. The second covered packaging the whole workflow as a coding-agent plugin, so every rule goes through the same gates from draft to merge request. Both posts solve the same problem: rule creation used to be slow and inconsistent, and now it is fast and consistent.
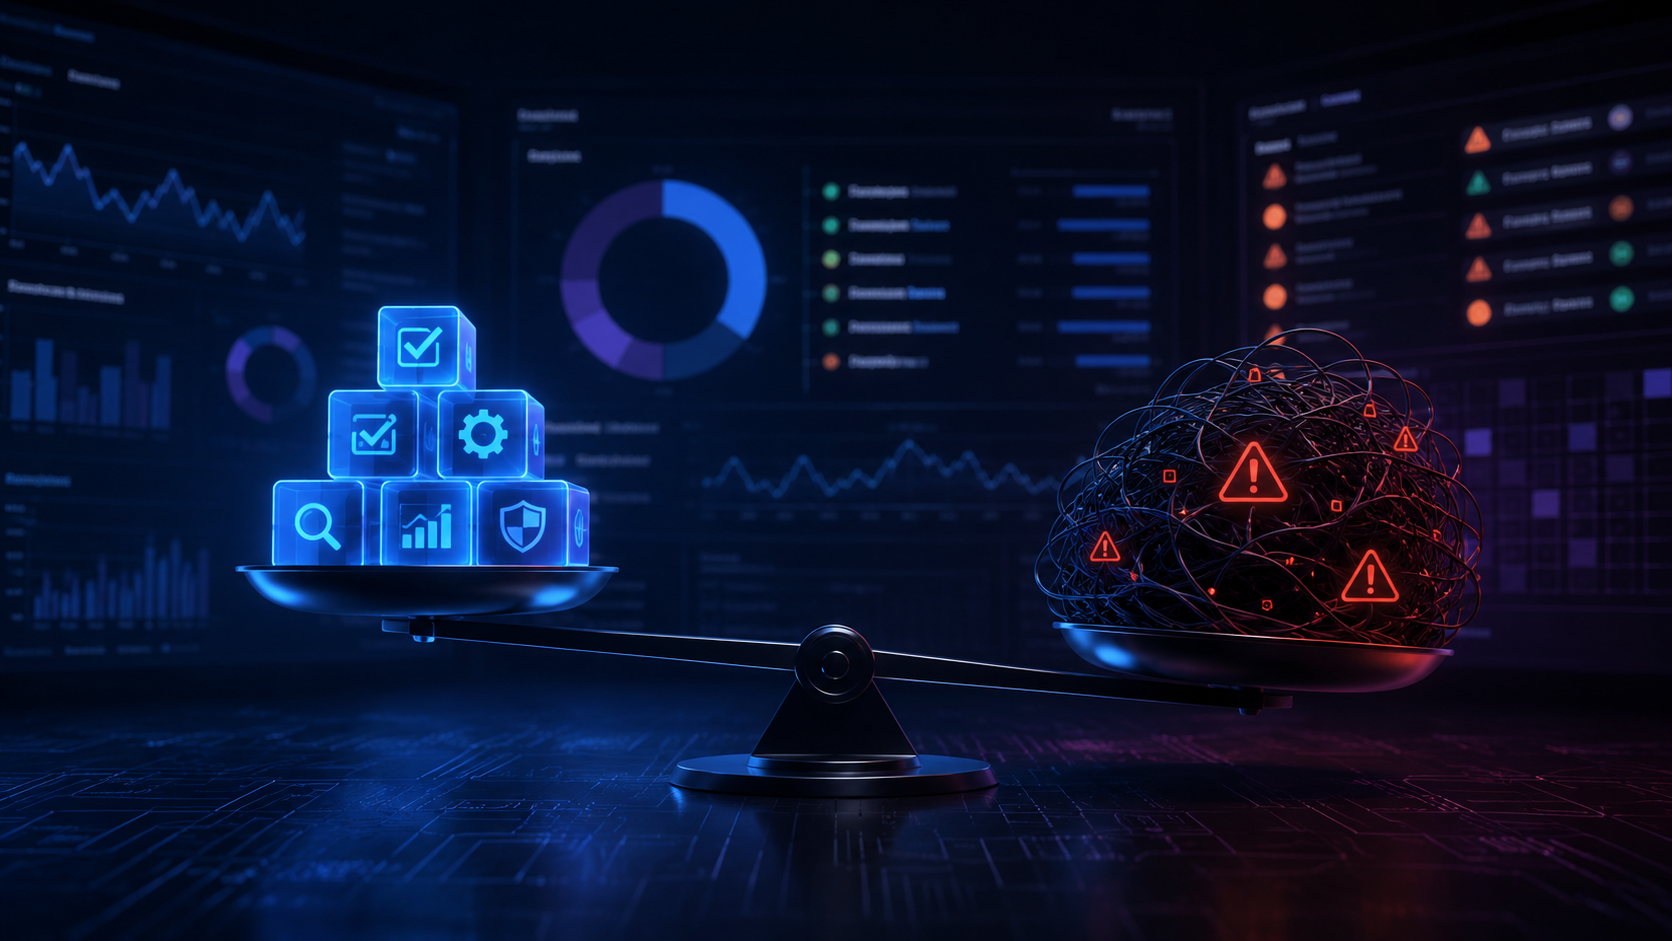
That success creates the next problem. Every deployed rule is a small recurring liability. It needs triage when it fires, tuning when it gets noisy, and retirement when its telemetry disappears. The agent cut the cost of creating a rule by an order of magnitude. It did nothing to the cost of maintaining one. When creation gets cheap and maintenance stays expensive, the failure mode of a detection program changes. You no longer fail by having too few rules. You fail by having hundreds of rules nobody is watching. This post is about the third piece: the metrics program that tells me which rules are earning their keep, which need work, and which need to go.
The bottleneck moved
Here is the arithmetic that forced this. Before the agent, a new rule took me somewhere between half a day and several days, so the portfolio grew by a handful of rules a month. Triage capacity and rule count stayed roughly in balance without anyone managing it. The scarcity of engineering time was, accidentally, a quality gate.
With the pipeline from the last post, a rule can take within 10 minutes depending on complexity, and hunting sessions routinely end with several merge requests instead of a page of notes. The portfolio grows faster than any accidental balance can hold.
Rules also decay silently, which I covered in the lifecycle section of the last post. A parser changes a field name. A log source gets migrated. A summarization job starts lagging. The rule keeps passing every syntax check while it detects nothing. Nothing in the SIEM tells you this happened. The only way to notice is to track what each rule actually does over time and look at the numbers on a schedule. That is the whole program: a record per rule, a few automated jobs that keep the records honest, and a review queue that forces the numbers in front of a human. There are startups offering to solve this problem (for example Fig, who have an excellent SOC resilience offering), but not everyone has access to go buying every tool under the sun to mature their processes.
What I track per rule
There is one record per rule, and the schema is deliberately boring. Every field is a primitive: text, number, boolean, or timestamp. No nested objects, no arrays. Boring schemas survive storage migrations, and every store on the market can hold them.
Each field exists to answer one question, and each question has an action attached. A metric that does not change a decision is decoration.
| Field | Question it answers | Action it drives |
|---|---|---|
| Canonical rule ID and name | Which rule is this, across renames? | Everything joins on this |
| Lifecycle state | Draft, in review, deployed, tuning, retired? | Routes the rule to the right queue |
| Deployed date | How long has this been live? | Starts the first review clock |
| Last fired | Is this rule alive? | Never fired in 90 days means validate or retire |
| 30-day fire count | How noisy is it? | Over the severity budget means tune |
| TP / benign-TP / FP counts | What did analysts decide? | High FP ratio means tune, TPs justify the rule |
| Severity | Who gets paged? | Sets the volume budget the counts are judged against |
| Last reviewed | When did a human last look? | Anchors the review SLA |
| Last tuned | When did the logic last change? | Separates "noisy" from "noisy despite tuning" |
| Notes | What did we already decide? | Stops re-proposing rejected changes |
Two of these deserve more words.
The canonical ID sounds trivial and is not. Early on, I renamed a rule as part of a cleanup, and its tracking record silently orphaned. The automation created a fresh record for the "new" rule, the old record kept aging, and the review queue showed one rule as overdue and its twin as brand new. The fix was a canonicalization step: every job that touches a record first resolves the rule to one canonical key, and a nightly sweep looks for records that no longer match a real rule. If you take one schema decision seriously, make it this one. Renames happen, and every rename is a chance for your metrics to fork.
The notes field is the one that matters most in the LLM era, and I will come back to it.
Where the numbers come from
No single system knows everything about a rule, so the record is stitched from three sources, each authoritative for one thing.
The git repository is authoritative for what the rule is. The detection-as-code repo from the last post holds the YAML: query, severity, MITRE mapping, notes. If the repo and the SIEM disagree, a drift job flags it, because a rule edited in the vendor console is a rule that escaped the process. In an ideal world analysts do not need access to edit rules in the UI and there is little friction tuning via repository.
The SIEM is authoritative for what is deployed and what fired. A scheduled job queries the SIEM's API for the rule inventory and for detection events, and stamps last-fired timestamps and 30-day counts onto the records. This is the same read-only search access the agent uses for hunting. One credential, one script, reused.
Case management is authoritative for what analysts decided. When a case closes, its disposition is a fact about the rule that fired it: true positive, benign true positive, false positive. A job watches closed cases, resolves each one to a canonical rule ID, and increments the counts.
The writes happen at lifecycle transitions, not on a poll. The drafting command fires a webhook when a draft starts. The submit command fires one when the merge request opens. The merge stamps the deployed date. A tuning merge stamps the last-tuned date and closes the tuning queue item. I covered the hard-won ordering lesson in the last post: the merge is the deployment, not the MR opening, and the state transition belongs on the event that changes the world.
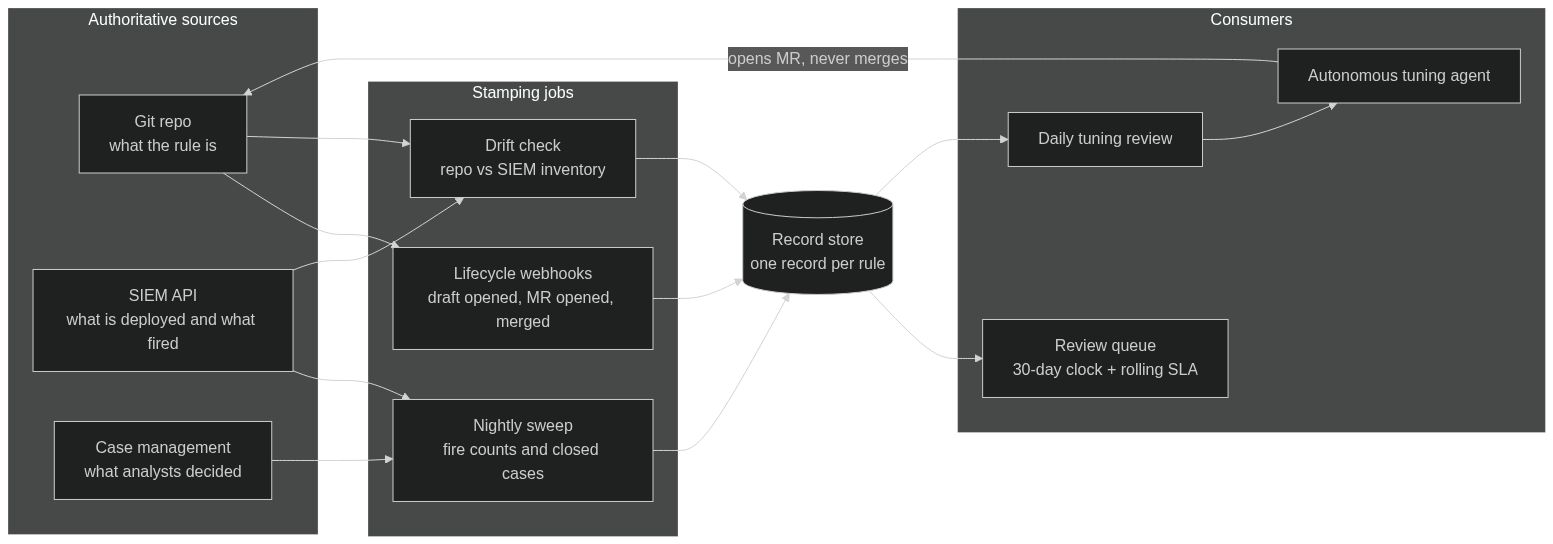
The loop on the left edge is the point of the diagram. The agent's tuning MR lands in the same git repo that fires the lifecycle webhooks, so the agent's own work flows back into the records through the same path as everyone else's.
For storage, I use the record store built into our SOAR platform, for one reason: the automation that stamps the records already lives there, so the writes are one action instead of an API integration. There is nothing special about that choice. The requirements are modest. The store needs an API for create, read, update, and delete. It needs timestamps. It needs queries you can filter by field. Any of these work: a SOAR platform's record or table feature, a Postgres or SQLite database, Airtable, ClickHouse if you already run it, or honestly a CSV in the git repo if your program is small and your jobs are scripts. The store is the least interesting decision in the whole system. The keys and the fields are the design. Pick the store you can query from both your automation and your terminal, and move on.
Reading the numbers without lying to yourself
The first time I put the full board in front of myself, I nearly made two bad calls in ten minutes. Both came from reading a blank cell as a zero.
The first trap is severity routing. In many environments, medium and above create cases that analysts must disposition. Low severity rules create alerts that feed dashboards and risk scoring, but no case, so nobody ever stamps a TP or FP on them. A low-severity rule with blank outcome counts is not a broken rule. It is a rule doing exactly what its tier is designed to do. Judge low-severity rules on volume and last-fired. Judge case-producing rules on dispositions. If you read one tier by the other tier's metrics, half your portfolio looks dead and the other half looks untriaged, and neither is true.
The second trap is the join. Some rules showed "never fired" that had fired plenty. The record was orphaned by the rename problem above, or the fire-count job had failed quietly for that rule's log source. A "never fired" verdict now triggers a manual query before any decision gets made, the same deliberately-suspicious posture the test stage takes on zero results. Blank cells have more than one cause, and only one of the causes is the rule's fault.
There is a third, softer trap: low-severity alerts age out untriaged by design, so "percentage triaged" is a meaningless number for that tier. Tune low-severity rules on raw volume. Do not wait for FP labels that will never come.
The review queue
Data nobody is forced to look at might as well not exist, so the program's front end is a queue, not a dashboard. A small internal web app lists every rule with its record, and two clocks put rules in front of me whether or not I go looking.
The first clock is the 30-day review. Every rule comes back for a look 30 days after deployment. New rules are where the surprises live: the volume estimate from testing was based on history, and production traffic gets a vote. The second clock is a rolling SLA after that, anchored to the last-reviewed date.
That anchor is a lesson I paid for. The first version anchored the SLA to the deployed date, so a rule deployed 200 days ago showed overdue the day after I reviewed it. The queue filled with rules that were fine, the real stragglers hid in the noise, and I started ignoring the queue, which is the death of any queue. Recurring SLAs anchor to the last human touch, not to the birthday.
When a rule comes up for review, the record gives me the numbers and the decision comes down to a few standing rules:
- A noisy low-severity rule that no one consumes does not get deleted. It gets routed into risk-based aggregation, where its individual fires stop demanding attention but still add signal to an entity's score. Volume is only a problem when it lands on a human.
- A medium-or-above rule with zero dispositions and a healthy last-fired is a quiet rule that works. It gets a note and a next review date, not a tune.
- A tune either cuts volume or fixes logic. Relabeling the severity so the noise lands in a quieter queue is not a tune, and the record makes that visible, because the fire count does not move.
- A rule whose telemetry is gone gets retired deliberately: confirm the source is really gone in the SIEM, not just quiet, then remove the rule through the same merge-request process that created it, and withdraw the record.
Every decision, including the decision to do nothing, gets written into the notes field with the reason.
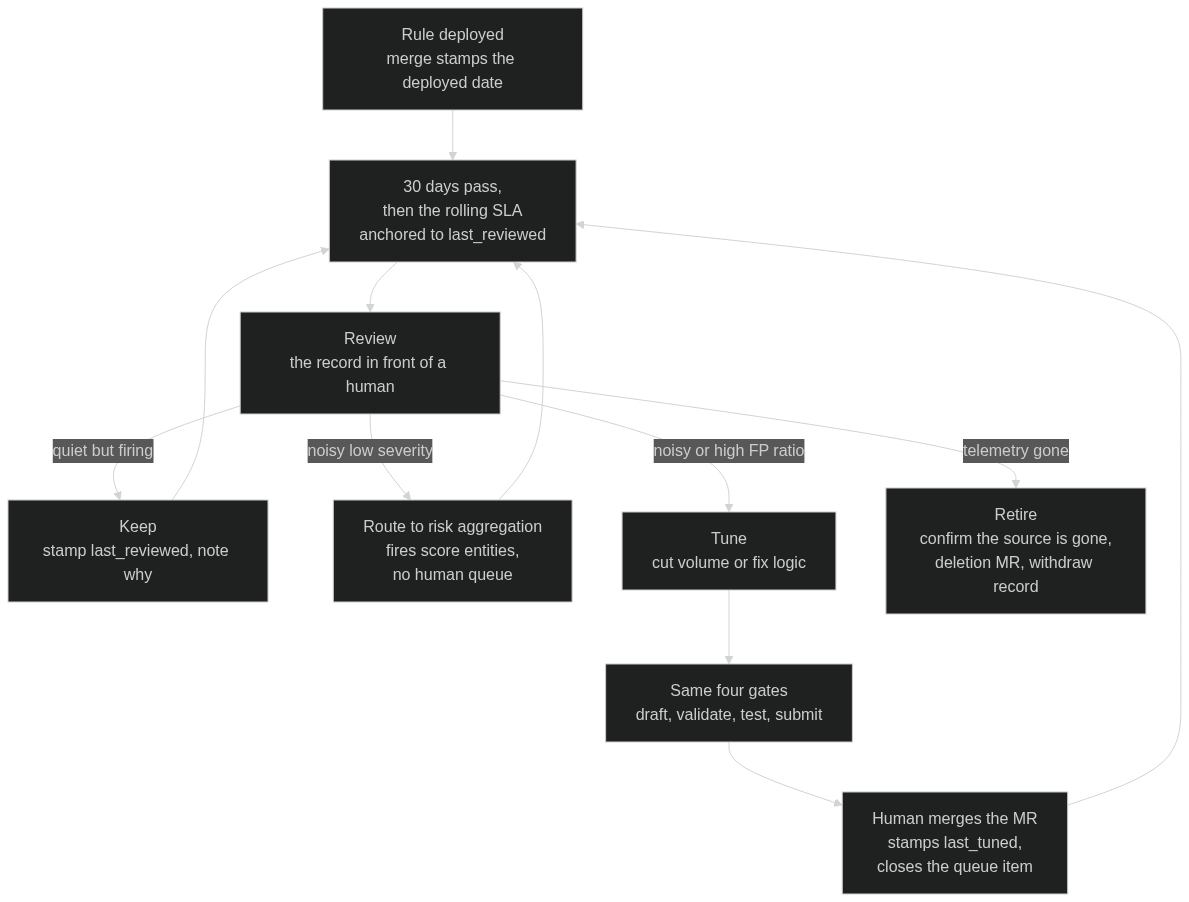
Retirement is the only exit. Everything else feeds the clock again, which is what makes the program a loop instead of a backlog.
The notes field is the institutional memory
Here is why that field matters more now than it did three years ago.
A tuning decision has context. "We considered excluding the backup service account and decided against it, because the same account was abused in an incident last year." A human team holds context like that in heads and hallway conversations, and it mostly works, because the same three people make every tuning call.
An agent holds nothing. Every session starts from zero, which was the founding problem of the last post, and it applies to tuning decisions exactly as it applied to process. An agent asked to quiet a noisy rule will find the biggest contributor and propose excluding it, and it will be right by the numbers and wrong by the history, and it will re-propose the same exclusion next month with total confidence.
So the rule's history has to live where the agent reads before it writes. My tuning workflow loads the rule's notes before it drafts anything, and the drafting instructions say plainly: if the notes record a decision against a change, do not propose that change again, and surface the conflict to the human instead. The notes field turned out to be the cheapest guardrail in the whole program. It is also the one a metrics program built for dashboards never includes, because a dashboard cannot read.
The agent in the loop
The metrics do not just get read at review time. Two automated jobs run against the store daily.
The first is a tuning review. Every morning, a job joins the cases that closed in the last 24 hours against each rule's 30-day history and surfaces candidates: rules whose FP ratio is climbing, rules that breached their severity's volume budget, rules whose fires all collapse to one entity. That last one is the same lesson as reading sample rows at test time. A count says "43 fires". The rows say "one service account, 43 times", and only the second one tells you what the tune is.
The second is an autonomous pass at the candidates. A scheduled agent session picks up the day's tuning candidates, pulls each rule's YAML and notes, drafts the exclusion or logic fix, baselines the change against history to prove the volume actually drops, and opens a merge request. It runs before I start work. It never merges. The boundary is the same one from the last post: the agent does the mechanical work up to the human gate, and the merge is the human gate. When the tuning MR merges, the automation stamps the last-tuned date and closes the queue item, and the loop is closed with no one updating a spreadsheet.
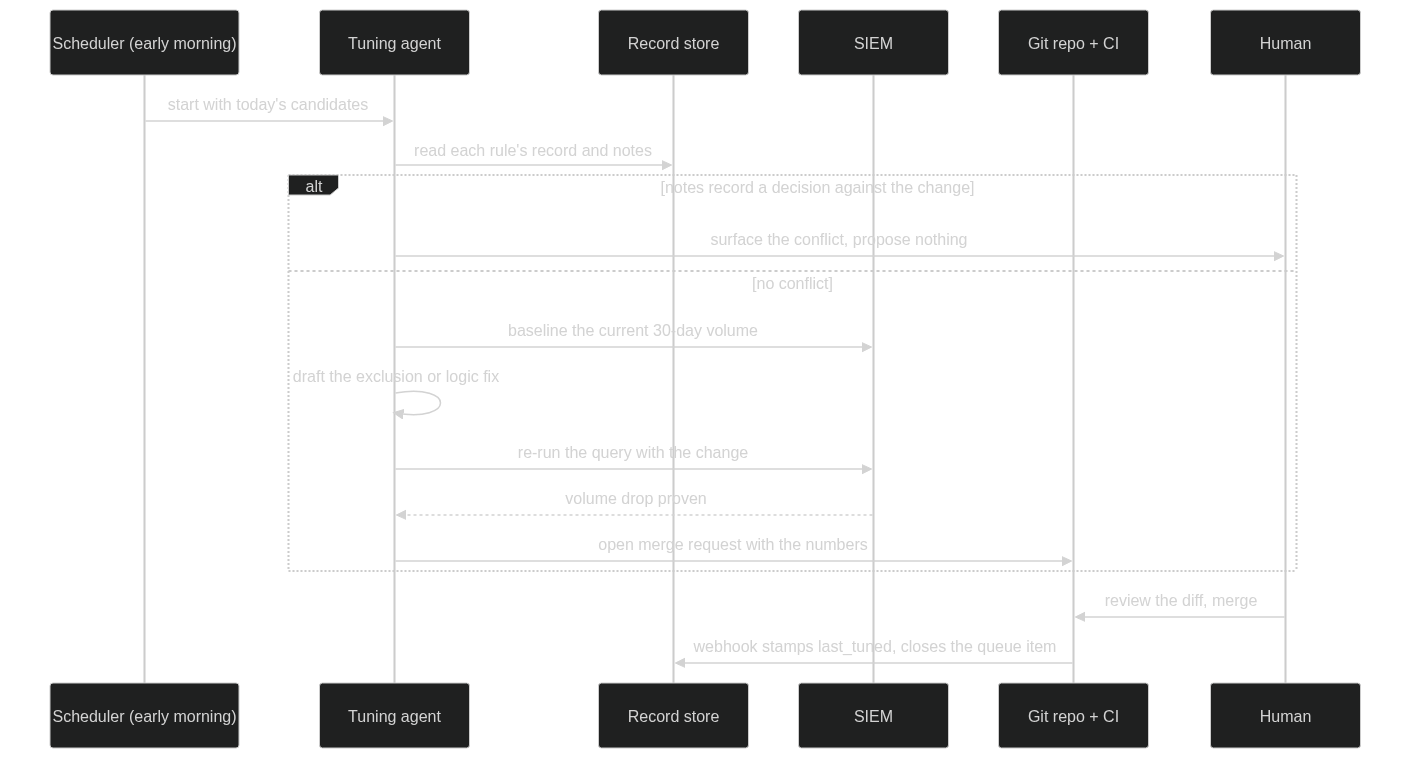
The alt branch at the top is the notes field doing its job. The agent checks the history before it drafts, and a prior "decided against" turns a proposal into a question for a human.
This is the part I would not have believed two years ago. The maintenance work that made big rule portfolios impossible for a small team, the daily grind of noticing noise, drafting exclusions, and re-baselining, is now the most automated part of the program. But it is only safe because every piece of the earlier work is under it: the tune goes through draft, validate, test, and submit like any other change, the linter runs in CI, the notes stop the agent from re-debate old decisions, and the metrics prove the tune worked. Speed without the record-keeping would just be noise generated faster.
Building it with whatever you have
Nothing above depends on a specific vendor. The program needs five components, and you likely own most of them already.
A rule store with review gates. A git repository with CI. GitHub or GitLab, it does not matter. This is the detection-as-code setup from the last post, and it is the prerequisite, because lifecycle events come from merge requests.
A metrics store. One record per rule, primitive fields, API access. A SOAR platform's built-in records or tables work. So does Postgres, SQLite, Airtable, or a wide table in ClickHouse. Small programs can start with a CSV in the repo and a nightly script, and honestly should, because you will redesign the fields twice in the first month and a CSV is cheap to redesign.
A case management system with an API. TheHive, ServiceNow, Jira, XSOAR, or whatever your SOC dispositions cases in. The one hard requirement: you must be able to query closed cases by time window and map each case back to the rule that fired it. If that mapping does not exist today, fix it first. Outcome data is the half of the program you cannot backfill.
A SIEM with an API. Two queries: the deployed rule inventory, and detection fires over a window. Splunk, Elastic, Sentinel, Chronicle, LogScale, all fine. This is the same scoped read-only credential the hunting and testing workflows use.
Glue. Something that runs on a schedule and on webhooks. A SOAR platform if you have one, otherwise cron plus Python, otherwise scheduled CI jobs in the same repo. The glue jobs are small: stamp a date on an event, sweep counts nightly, reconcile records against reality.
Build it in this order. Define the canonical rule key first, and make every system agree on it. Stand up the record store with a nightly sweep for fire counts and closed cases, because that alone answers "which rules are dead and which are loud", and that is most of the value. Add the lifecycle webhooks when the manual stamping annoys you. Add the review queue with the two clocks. Add the notes field before you let any agent near tuning. The autonomous tuning pass comes last, after the gates it depends on exist.
The three posts, together
The lifecycle from the last post had eight stages, and the three posts cover it end to end. Getting the model to write real queries is stage 2 and 3, research and draft. The plugin is stages 2 through 7, the pipeline from schema to merge. This post is stage 8, operate, plus the record-keeping in stage 7 that makes operating possible. The loop closes where operate feeds back into intake: a tuning candidate is just an intake event with better evidence than most.
What the LLM era actually changed is where the human time goes. I used to spend most of my detection time writing queries and shepherding them into production, and the maintenance debt accumulated quietly because nobody had hours left to look at it. Now the writing and shepherding are largely mechanical, and my time goes to the judgement calls the records surface: is this rule worth its noise, is this exclusion safe given the history, is this telemetry really gone. The agent did not remove the human from the program. It moved the human to the decisions that were always the actual job.
The uncomfortable version of that sentence: if your program has no numbers, the agent moves you nowhere, because you cannot make judgement calls about rules you are not measuring. An agent made the rules cheap to write. The metrics are what keep cheap rules from becoming an expensive alert queue.
